
The 2,000-Point Dow Drop: Context Matters More Than You Think
Don't panic over a 2,000-point Dow Jones drop. Discover why its true significance depends on whether the index is at 10,000 or 30,000.
When a 2,000-Point Dow Jones Drop Isn’t What You Think It Is
When news headlines scream about the Dow Jones dropping 2,000 points, it sounds catastrophic. Many people immediately picture financial ruin or a looming recession. Here’s a secret: a 2,000-point drop isn’t always as alarming as it sounds, especially compared to past market crashes.
The real story lies in context. A 2,000-point decline means something very different when the Dow is at 10,000 versus when it’s at 30,000. It’s like losing 2 pounds when you weigh 100 pounds versus losing 2 pounds when you weigh 300 pounds. The absolute number is the same, but the percentage is vastly different.
The Dow Jones: What It Is and How It Moves
The Dow Jones Industrial Average (DJIA) is a stock market index. It tracks the performance of 30 large, publicly owned companies listed on stock exchanges in the United States. Think of it as a snapshot of a specific segment of the American economy. S&P Dow Jones Indices manages this index.
These companies include giants like Apple, Microsoft, and McDonald’s. Its value is calculated based on the stock prices of these 30 companies. The Dow is a price-weighted index, meaning higher-priced stocks influence its value more.
A “point” in the Dow represents a unit of movement in the index’s value. It isn’t a dollar amount. For example, if the Dow gains 100 points, it means the combined average price of its component stocks has increased. Investors watch these points, but they often miss the bigger picture.
Percentage changes offer a clearer view of market shifts. A 2,000-point drop from a 10,000-point starting level is a 20% decline. This signifies a major market event. However, a 2,000-point drop from a 30,000-point starting level is only about a 6.7% decline. While still significant, it’s far less severe.
Historic 2,000-Point Drops: The Reality Behind the Headlines
March 2020 brought unprecedented volatility to global financial markets. The COVID-19 pandemic triggered a series of massive point drops for the DJIA. These events provide clear examples of how large point drops translate into percentage declines.

In March 2020, the COVID-19 pandemic triggered unprecedented volatility and a series of massive point drops for the Dow Jones Industrial Average, serving as a stark example of how large absolute declines translate into significant percentage shifts. (Source: thestreet.com)
On March 9, 2020, the DJIA fell by 2,013.76 points, or 7.79%. This sharp decline was fueled by growing fears about the pandemic’s economic impact. An escalating oil price war between Saudi Arabia and Russia further spooked investors, according to reports from Bloomberg News.
Just three days later, on March 12, 2020, the Dow plunged again. It dropped 2,352.60 points, representing a 9.99% fall. This marked the worst single-day percentage decline for the index since the 1987 “Black Monday” crash. Investors sold off stocks broadly, seeking safety in less risky assets.
The largest point drop in the Dow’s history occurred on March 16, 2020. The index shed 2,997.10 points, a staggering 12.93% decline. This was its third-worst percentage drop ever. The economic uncertainty caused by widespread lockdowns created intense investor panic.
During these tumultuous days, market regulators implemented circuit breakers. These are temporary halts to trading. They activate when major stock indices like the S&P 500 fall by specific percentages, usually 7%, 13%, and 20%. Circuit breakers aim to prevent cascading panic selling and give investors time to process information, as explained by the U.S. Securities and Exchange Commission (SEC).
Beyond the Numbers: The Economic Fallout and Response
The dramatic market declines of March 2020 had real-world consequences. On March 23, 2020, the DJIA hit its pandemic low of 18,591.93. This swift downturn impacted millions of Americans’ retirement accounts and greatly eroded consumer confidence.
Governments and central banks responded quickly and forcefully. The Federal Reserve took aggressive monetary policy actions. It slashed its benchmark interest rate to near zero, according to statements by then-Chair Jerome Powell. The Fed also initiated large-scale asset purchases, a practice known as quantitative easing.
Quantitative easing involves a central bank buying government bonds and other securities. This action injects liquidity into the financial system. It aims to lower long-term interest rates and stimulate economic activity. The goal was to stabilize markets and encourage lending.
Congress also enacted massive fiscal stimulus measures. The CARES Act, passed in March 2020, provided direct payments to households. It also offered expanded unemployment benefits and loans to businesses. These measures totaled over $2 trillion, as reported by the U.S. Department of the Treasury. These coordinated efforts helped cushion the economic blow and set the stage for a market recovery.

Circuit breakers are temporary halts to trading on stock exchanges, designed to prevent panic selling during sharp market declines. They were activated multiple times in March 2020 as the Dow plunged, giving investors time to process information. (Photo: Leeloo The First, Pexels)
Why Market Volatility Is a Constant Companion
The DJIA began trading in 1896. Since then, it has endured numerous periods of extreme volatility. Market swings are not anomalies; they are an inherent feature of financial markets. Many factors contribute to these fluctuations.
Geopolitical events frequently trigger market reactions. Wars, trade disputes, and international crises create uncertainty. Investors often pull back from risky assets in such environments. Economic data also plays a critical role.
Reports on inflation, unemployment, and gross domestic product directly influence market sentiment. Positive data can fuel rallies, while negative news can spark sell-offs. Unexpected company earnings from major corporations also move markets. Poor performance from a Dow component, for example, can drag down the entire index.
Technological advancements and disruptive innovations constantly reshape industries. These shifts create winners and losers, impacting stock valuations. Ultimately, investor psychology exerts a powerful force. Fear and greed often drive market movements beyond rational economic analysis.
Financial historian Robert Shiller, a Nobel laureate from Yale University, highlights the role of “narratives” in market bubbles and crashes. He explains how collective stories and emotional responses can amplify market shifts. Market corrections, defined as a 10% decline from a recent peak, and bear markets, a 20% or more drop, are normal parts of economic cycles. They represent periods of readjustment.
Navigating Future Market Swings
Despite all the dramatic drops and periods of panic, the DJIA has shown remarkable long-term resilience. Since its inception, the index’s value has trended upwards over decades. This trend holds true even with numerous recessions and crises along the way. Understanding this historical context is vital for investors.
Approaching market volatility requires a strategic mindset. Experts often advise investors to adopt a long-term perspective. Panicking and selling off investments during downturns can lock in losses. Instead, many financial advisors recommend staying invested through market cycles.
Diversification is another key strategy. Spreading investments across different asset classes, industries, and geographies can reduce risk. If one sector or region performs poorly, others might perform well, balancing the portfolio. Investing a fixed amount regularly, known as dollar-cost averaging, can also mitigate risk. This strategy means buying more shares when prices are low and fewer when prices are high.
Staying informed about global economic trends and underlying market factors is crucial. This knowledge helps investors make rational decisions rather than emotional ones. Financial institutions and advisors provide valuable analysis and risk management tools. While future market swings are guaranteed, understanding their nature helps individuals navigate them successfully.
FAQ
What is a “point” in the Dow Jones? A “point” is simply a unit of measurement for the Dow Jones Industrial Average’s value. It reflects the overall movement of the 30 component stocks. It does not directly correspond to a dollar amount.
Why do percentages matter more than points? Percentages provide a relative measure of change, indicating the severity of a market move. A 2,000-point drop means a 20% decline at 10,000 points but only a 6.7% decline at 30,000 points. Percentages offer a more accurate comparison over time.
What are market circuit breakers? Circuit breakers are temporary trading halts enacted by exchanges when major stock indices fall by certain percentages. They are designed to prevent rapid, uncontrolled selling. They give investors time to assess information during extreme market volatility.
How quickly can markets recover from a big drop? Market recovery times vary widely, depending on the cause and severity of the downturn. Some drops are followed by swift “V-shaped” recoveries, like after the initial COVID-19 shock. Others, like the 2008 financial crisis, lead to longer, more gradual recoveries.
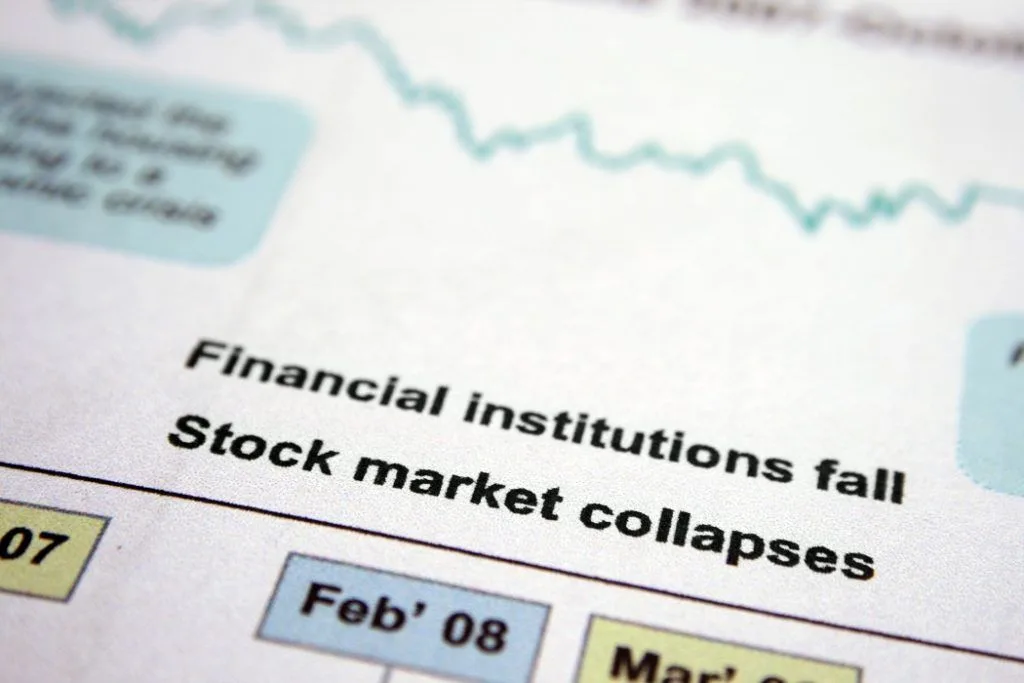
The 2008 financial crisis, sparked by the collapse of the housing market and subprime mortgages, led to a severe global recession and a prolonged, gradual recovery in markets, serving as a stark example of a non-'V-shaped' recovery. (Source: corporatefinanceinstitute.com)